How to Choose the Best Cut And Die Machine?
Choosing the right Cut And Die Machine can shape your production quality, speed, and long-term operating costs. A machine that performs well on paper may struggle with your actual materials. Cardboard, foam, rubber, labels, and laminated sheets each demand different cutting pressure and tooling.
Begin with the material, not the machine brand. Check its thickness, hardness, surface finish, and expected sheet size. Then compare cutting accuracy, die compatibility, production speed, and adjustment controls. A reliable machine should create clean edges without crushing delicate layers. It should also maintain consistent registration across repeated batches.
Small details matter.
During evaluation, inspect the working area, guarding, emergency controls, and maintenance access. Ask suppliers for sample cuts using your own materials. Review technical specifications carefully, but do not rely on them alone. A machine rated for high output may require frequent setup changes, which can reduce real productivity. Energy use, spare-part availability, operator training, and after-sales support also influence the true cost.
There is no perfect choice. Even experienced buyers can overlook noise, cleaning time, or software limitations. A careful comparison helps expose these weaknesses before installation. Record test results, including cutting speed, waste levels, edge quality, and downtime. With practical evidence and clear production goals, you can select a Cut And Die Machine that supports dependable results rather than impressive promises.
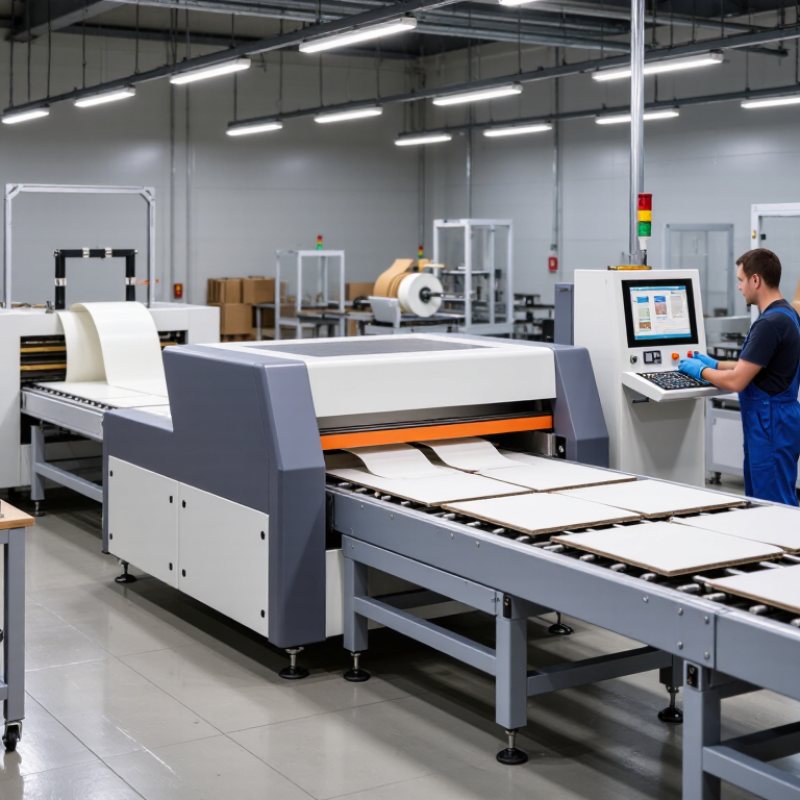
Set Material, Volume, and Tolerance Targets: GSM, ±0.1 mm, and Run Length
Choosing the best cut and die machine starts with measurable targets, not machine speed alone. Define material GSM, production volume, and dimensional tolerance before requesting quotations. GSM means grams per square metre, and ISO 536 specifies the standard method for measuring paper and board grammage. A 350 GSM board can behave very differently from a 350 GSM laminated sheet. Moisture, coating, grain direction, and compression also affect cutting stability.
Volume determines the machine’s useful configuration. Smithers’ report, The Future of Packaging Print to 2028, forecasts packaging print value to exceed 600 billion US dollars by 2028. That growth makes run-length planning more important. Short runs may favour quick setup and low tooling waste. Long runs need durable dies, consistent feeding, and repeatable pressure. Record expected sheets per job, monthly volume, changeover frequency, and the longest planned run. A fast machine may still be inefficient.
Tolerance needs practical verification. If the target is ±0.1 mm, measure registration at the beginning, middle, and end of a run. Use calibrated gauges, controlled samples, and the actual substrate. ISO 12647-2 supports process control principles, but it does not guarantee cutting accuracy. Ask for test cuts, not impressive specifications. I have seen a machine meet tolerance on one dry sheet and drift after several hours. That weakness should be documented. Humidity was the overlooked variable. Run-length trials reveal more than brochures.
Compare Flatbed, Rotary, and Laser Systems: 1,000–30,000 Impressions/Hour
Choosing the best cut and die machine starts with production volume, material behavior, and acceptable waste. A flatbed system commonly delivers about 1,000–5,000 impressions per hour. It suits short runs, thick board, foam, and mixed job sizes. Operators can change tooling quickly and inspect each sheet closely. That control matters when registration is demanding.
Rotary systems can reach roughly 8,000–30,000 impressions per hour with continuous web feeding. They perform well on long runs using labels, films, paper, and other flexible materials. However, setup cylinders and tooling can increase preparation time and cost. Laser systems offer digital flexibility rather than a fixed impression rate. Depending on material and cut density, practical output may range from 1,000 to 10,000 equivalent impressions per hour. Complex shapes require more beam movement.
I once selected a faster rotary process for a medium run and underestimated setup waste. The hourly rate looked impressive, but the final cost was not. That mistake changed my evaluation method. I now test the actual substrate, including curled edges, adhesive variation, and fine internal cuts. Small details matter. Ask suppliers for a timed sample using your artwork and material. Record setup minutes, usable sheets, rejects, and operator adjustments. A flatbed may win on flexibility, while rotary wins on repeat volume. Laser is often strongest when designs change frequently. The advertised maximum is only a starting point.
How to Choose the Best Cut and Die Machine?
Typical production throughput varies with substrate, sheet size, die complexity, waste removal, and setup time. Rotary systems generally deliver the highest continuous output, while flatbed and laser systems offer greater flexibility for short runs and variable designs.
Match Cutting Force to Board Thickness Using kN Ratings and Safety Margins
Choosing a cut and die machine starts with force, not table size. Match the machine’s usable kN rating to board thickness, flute structure, and total cutting perimeter. FEFCO’s 2023 statistics report more than 40 billion square metres of European corrugated output, showing how widely board grades can vary. A single “corrugated board” setting is not reliable.
Estimate cutting demand from die perimeter, caliper, compression resistance, and production speed. Then add a practical safety margin of 20–30 percent. This margin is engineering guidance, not a universal standard. For example, a 3 mm double-wall sheet needs more force than a 1.5 mm single-wall sheet, even with the same artwork. Creasing, stripping, and uneven pressure can raise the real load. Ask for force-test records using your actual board.
In production trials, kN ratings are often misunderstood. Some figures describe maximum peak force, while others indicate continuous working capacity. That difference matters. My first estimate was too generous once blunt rules and recycled board were introduced. Check the machine’s rated working force against ISO 12100 risk-assessment principles and ISO 12643 safety requirements. Leave room for board moisture, die wear, and future thickness changes. More force is not automatically better. Excessive force can crush flutes, damage the cutting plate, and increase maintenance costs. Test before buying.
How to Choose the Best Cut And Die Machine? - Match Cutting Force to Board Thickness Using kN Ratings and Safety Margins
| Board or Material Type | Typical Thickness | Typical Application | Estimated Cutting Force
per 1 m Cut Length | Suggested Safety Factor | Calculated Working Force | Minimum Recommended Machine Rating | Selection Guidance |
| Paper | 0.15–0.30 mm | Labels, inserts, lightweight sleeves | 1.5–2.5 kN | 1.35× | 2.0–3.4 kN | 3.5 kN | Suitable for light-duty flatbed cutting when the die has a short cutting perimeter and limited embossing. |
| Folding Carton Board | 0.35–0.50 mm | Retail cartons, pharmaceutical cartons | 3.0–5.0 kN | 1.35× | 4.1–6.8 kN | 7 kN | Choose additional capacity if the job includes crease rules, perforations, or dense internal cutouts. |
| Heavy Folding Carton Board | 0.60–0.80 mm | Rigid cartons, display packaging | 5.0–8.0 kN | 1.40× | 7.0–11.2 kN | 12 kN | A larger safety margin helps maintain cut quality as the blade dulls or board moisture changes. |
| Solid Bleached Board | 0.90–1.20 mm | Premium packaging, rigid presentation cards | 8.0–12.0 kN | 1.40× | 11.2–16.8 kN | 18 kN | Use a machine with good platen parallelism to prevent uneven cutting across the sheet. |
| Micro-Flute Corrugated Board | 1.00–1.80 mm | Small shipping boxes, protective sleeves | 10.0–16.0 kN | 1.40× | 14.0–22.4 kN | 24 kN | Allow extra capacity for flute compression, liner variation, and creasing operations. |
| E-Flute Corrugated Board | 1.50–2.00 mm | Retail-ready boxes, mailers | 12.0–18.0 kN | 1.45× | 17.4–26.1 kN | 28 kN | Verify that the machine can handle the board height without excessive crushing or incomplete cuts. |
| B-Flute Corrugated Board | 2.50–3.20 mm | Shipping cartons, protective packaging | 20.0–32.0 kN | 1.50× | 30.0–48.0 kN | 50 kN | Higher force capacity is recommended for long cut lines, heavy liners, and multi-up production. |
| Thick Solid Board | 2.00–4.00 mm | Book covers, rigid folders, backing boards | 18.0–50.0 kN | 1.50× | 27.0–75.0 kN | 30–80 kN | Confirm the machine's maximum board thickness, bed stiffness, and die height before purchase. |
Verify Registration, Automation, and OEE Against 75%+ Production Targets
Choosing a cut and die machine should begin with its 75%+ production target, not its advertised speed. OEE combines availability, performance, and quality. Widely cited OEE benchmark guidance places average manufacturing performance near 60%, while 85% is considered world-class. A 75% target is practical. It is not sacred.
Check registration under real conditions. Ask for repeatability data across long runs, changing substrates, and higher speeds. A 0.2 mm drift can create visible waste on labels, cartons, or layered materials. Confirm camera response time, web tension control, and setup recovery. Automation should reduce manual adjustments, not hide them. Deloitte’s 2023 Global Smart Manufacturing Survey found that 86% of manufacturers expect smart manufacturing to strengthen competitiveness within five years. That expectation requires usable data, not decorative dashboards.
Tips: Run a witnessed acceptance test. Record setup minutes, stoppages, scrap, and good output. Calculate OEE from the same definitions used on your factory floor. Compare the result with 75%, then investigate each loss category. Do not accept one perfect shift as proof. My practical concern is often overlooked: operators may bypass sensors when alarms interrupt production. That is an imperfect design signal. Check recipe control, maintenance access, spare-part availability, and training time. A machine that reaches 75% only with one expert operator is not truly production-ready.


